We’ve launched upgraded platform features, creating a new digital marketing ecosystem addressing challenges faced by our brands and online publishers worldwide.
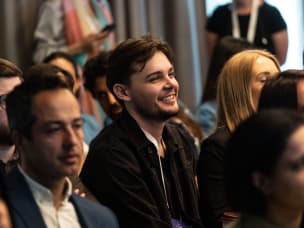
Awin's annual Black Tie event, themed 'Transcend,' was a night to remember, delivering exciting company news in an other-worldly setting to 450 guests.
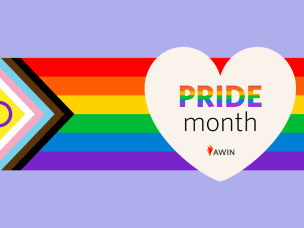
With it being harder to show Pride globally in 2023, Alex from Awin's LGBTQIA+ network: Priders, reflects on what the group has achieved in it's first 7 months.
Discover our affiliate and partner marketing trend reports, market research, sector trends and editorial publications, offering the most comprehensive industry insights.